Contact Hotline

2026 EIC Office Community Survey Results

The Ethics, Integrity, and Compliance (EIC) Office launched its inaugural community-wide survey in early 2026 to better understand faculty and staff awareness of university ethics and compliance resources, reporting options, and expectations. The results will help inform future outreach, education and support across the University of Michigan and Michigan Medicine.
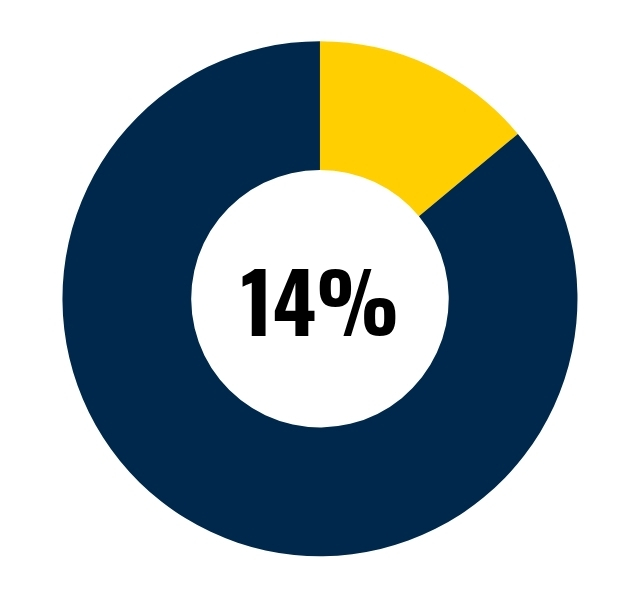
There was an overall participation rate of 14% with 8,140 responses received.

Circle graph showing 14% overall participation rate based on responses received


The survey was distributed to 58,340 faculty and staff across the Ann Arbor, Dearborn and Flint campuses, as well as Michigan Medicine. A total of 8,140 individuals participated, representing a 14% response rate—exceeding the 10% benchmark commonly used for surveys of this type.
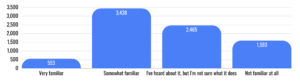
50% of respondents were Very Familiar or Somewhat Familiar with the EIC Office


Bar chart showing respondents’ level of familiarity with an unspecified topic, program, office, or process. The chart uses four large blue vertical bars with rounded tops, each labeled with a white count value. The y-axis ranges from 0 to 3,500 in increments of 500. From left to right, the response categories and counts are: Very familiar: 553 Somewhat familiar: 3,438 “I’ve heard about it, but I’m not sure what it does”: 2,465 Not familiar at all: 1,593 The highest number of respondents reported being somewhat familiar, followed by those who had heard about it but were unsure what it does. Far fewer respondents said they were very familiar, while a substantial number said they were not familiar at all.

Positive Minds

While there is room for improvement, these responses indicate a positive community mindset around ethical and compliant behavior
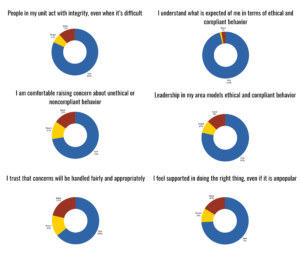
Infographic with six donut charts summarizing survey responses about ethics, compliance, integrity, and psychological safety. Each chart uses blue for Agree, yellow for Disagree, and dark red for Neutral. In reading order from top left to bottom right: “People in my unit act with integrity, even when it’s difficult”: 81.9% Agree, 6.5% Disagree, and 11.6% Neutral. “I understand what is expected of me in terms of ethical and compliant behavior”: 95.8% Agree, approximately 2.2% Disagree, and 2.0% Neutral. “I am comfortable raising concern about unethical or noncompliant behavior”: 72.4% Agree, 12.4% Disagree, and 15.2% Neutral. “Leadership in my area models ethical and compliant behavior”: 78.5% Agree, 8.5% Disagree, and 13.0% Neutral. “I trust that concerns will be handled fairly and appropriately”: 64.2% Agree, 14.5% Disagree, and 21.4% Neutral. “I feel supported in doing the right thing, even if it is unpopular”: 74.0% Agree, 9.6% Disagree, and 16.3% Neutral. Overall, the charts show majority agreement across all six statements, with the strongest agreement for understanding ethical and compliant behavior expectations and the lowest agreement for trusting that concerns will be handled fairly and appropriately.


Impactful Opportunities

The reporting process continues to allow room for improvement.
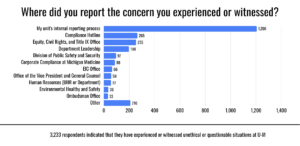
 

Horizontal bar chart titled “Where did you report the concern you experienced or witnessed?” The chart shows the number of respondents who reported a concern through various University of Michigan offices or reporting channels. Blue horizontal bars are arranged from largest to smallest count, with the reporting channel labels on the left and numeric counts shown at the end of each bar. The x-axis ranges from 0 to 1,400. Reported locations and counts are: My unit’s internal reporting process: 1,206 Compliance Hotline: 265 Equity, Civil Rights, and Title IX Office: 255 Other: 210 Department Leadership: 198 Division of Public Safety and Security: 97 Corporate Compliance at Michigan Medicine: 88 EIC Office: 66 Office of the Vice President and General Counsel: 59 Human Resources, UHR or Department: 57 Environmental Health and Safety: 36 Ombudsman Office: 33 A note below the chart states: “3,233 respondents indicated that they have experienced or witnessed unethical or questionable situations at U-M.” The most common reporting location was the respondent’s unit internal reporting process, which received far more reports than any other listed option.


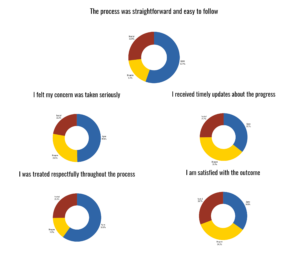
Infographic with five donut charts showing survey responses about a concern-reporting or resolution process. Each donut chart uses blue for Agree, yellow for Disagree, and dark red for Neutral. In reading order from top to bottom, left to right: “The process was straightforward and easy to follow”: 55.4% Agree, 17.7% Disagree, and 26.9% Neutral. “I felt my concern was taken seriously”: 49.6% Agree, 28.2% Disagree, and 22.2% Neutral. “I received timely updates about the progress”: 35.7% Agree, 39.1% Disagree, and 25.2% Neutral. “I was treated respectfully throughout the process”: 59.9% Agree, 14.8% Disagree, and 25.3% Neutral. “I am satisfied with the outcome”: 34.8% Agree, 34.5% Disagree, and 30.7% Neutral. Overall, respondents were most positive about being treated respectfully and finding the process straightforward, while satisfaction with the outcome and receiving timely updates had the lowest agreement and the highest disagreement.


Key Findings & Opportunities

The EIC Office identified the following opportunities based on the survey results:

Focus on ensuring that managers and supervisors have the resources needed to support their people.

Increase awareness of reporting avenues and options available to the community.

Compare to data from current climate survey and continue to refine & align priorities.

Continue to explore concerns of retaliation.
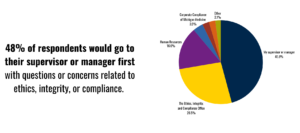
Slide with large summary text on the left and a pie chart on the right showing where respondents would go first with questions or concerns related to ethics, integrity, or compliance. The large text on the left reads: “48% of respondents would go to their supervisor or manager first with questions or concerns related to ethics, integrity, or compliance.” The pie chart shows that the most common first point of contact is “My supervisor or manager” at 45.8%, represented by the largest dark blue segment. The second largest segment is “The Ethics, Integrity, and Compliance Office” at 26.5%, shown in yellow. The third largest segment is “Human Resources” at 16.6%, shown in purple. Smaller segments include “Corporate Compliance of Michigan Medicine” at 3.9% and “Other” at 2.1%. The chart also contains two very small additional slices that together account for the remaining responses, but their labels are not visible in the image. Overall, the slide emphasizes that nearly half of respondents would first bring ethics, integrity, or compliance questions or concerns to their supervisor or manager.

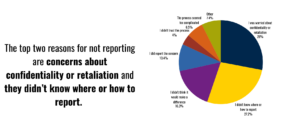
Slide with a large text summary on the left and a pie chart on the right explaining reasons respondents did not report a concern they experienced or witnessed. The large text on the left reads: “The top two reasons for not reporting are concerns about confidentiality or retaliation and they didn’t know where or how to report.” On the right, a pie chart shows the distribution of reasons for not reporting. The largest segment is “I was worried about confidentiality or retaliation” at 28%, followed closely by “I didn’t know where or how to report” at 27.2%. Other reasons include “I didn’t think it would make a difference” at 16.3%, “I did report the concern” at 10.4%, “Other” at 7.4%, “The process seemed too complicated” at 6.5%, and “I didn’t trust the process” at 4%. Overall, the chart emphasizes that the two most common barriers to reporting were fear of confidentiality breaches or retaliation and lack of knowledge about where or how to report.

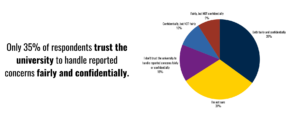
Slide with large summary text on the left and a pie chart on the right about trust in the university’s handling of reported concerns. The large text on the left reads: “Only 35% of respondents trust the university to handle reported concerns fairly and confidentially.” The pie chart shows five response categories. The largest segment, shown in dark blue, is “Both fairly and confidentially” at 35%. The second largest segment, shown in yellow, is “I’m not sure” at 31%. A purple segment indicates “I don’t trust the university to handle reported concerns fairly or confidentially” at 15%. A blue segment indicates “Confidentially, but NOT fairly” at 10%. A dark red segment indicates “Fairly, but NOT confidentially” at 9%. Overall, the slide emphasizes that just over one-third of respondents trust the university to handle reported concerns both fairly and confidentially, while nearly one-third are unsure and the remaining respondents have concerns about fairness, confidentiality, or both.

Contact Hotline